Now that my son is attending Kenyon College, I am on the mailing list for its alumni bulletin. In Volume 36, number 2 had an article by Jay Corrigan, Associate Professor of Economics titled: “Why Are the Rich Getting Richer?” The article states that 10% of Americans earn half of all the US income. That is the highest percentage since the US government started keeping records in the early 1900s. The article points out that in the last 40 years the richest 10% gained ground in Canada, Germany and Japan too! The top 10% has done very well in comparison to the rest of the country in emerging markets, such Brazil, Russia, India and China, but at least a rising tide of wealth has benefited most everyone in these countries! The professor looked at an era when income inequality declined in the US, the 1940s, 50s and 60s.
During that period there was a large influx of highly skilled workers through veterans entering college en masse after World War II, women entering the workforce and any college degree improving someone’s skill. These forces converged so that the supply of highly skilled people who could do most high paying jobs grew faster than the demand for those positions. As a result, the difference between the highest paid managers and lower levels managers was kept in lower multiples. Almost all of these trends reversed around 1980.
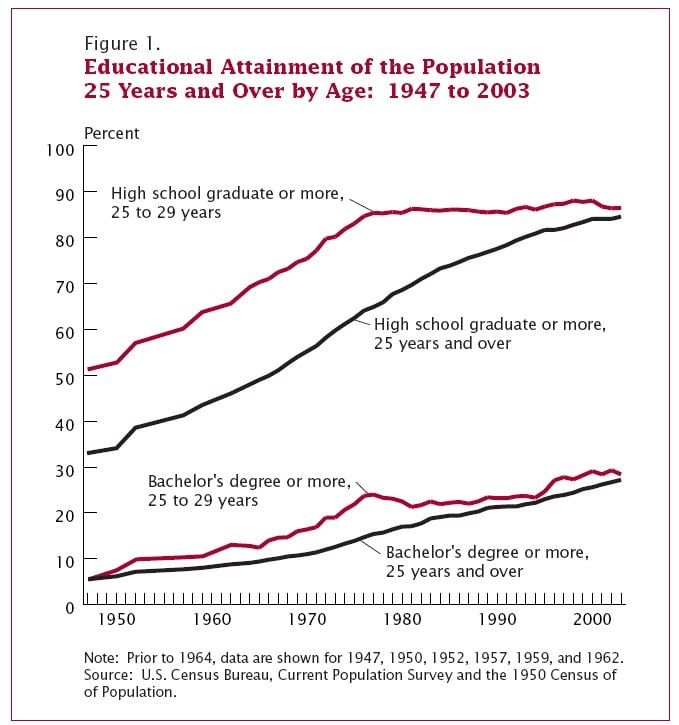
According to the US Census Bureau, about half the US population graduated high school in 1947 that number rose rapidly to about 85% by 1980 and has stagnated since then. The percentage for a bachelor’s degree rose from about 5% of the population in 1947 to about 30% by 2009. If you look at people ages 25 to 29 (excluding those earning degrees after that age), there was a steep increase until 4 years after the end of the Vietnam War and the elimination of the draft. Then a noticeable drop and almost no growth in the percentage of people earning a bachelor’s degree until about 1996 and then it has grown since (see chart below).
The Kenyon Professor goes on to discuss the fact that from 1980 to the present, as the number of enrollees in college has continued to rise, the number of people graduating has not, as a result the skill gap has increased. The professor blames rising costs for college and poor preparation by the US public education system as the two root causes for the problem. The professor goes on to opine that the low hanging fruit for better educating the population living in the US are already picked, so the best move for the US is to encourage more immigration.
The Kenyon professor is not the only person studying this issue. On January 27th, The Seattle Times published an article by AP economic writers Christopher S. Rugaber and Josh Boak titled “Wealth Gap: A Guide to What it is, Why it Matters.” The article basically lays out the argument that there are several trends, not just one or two, which have come together to increase the wealth gap. The authors state that prior to 1980 American’s income (both wealthy and everyone else) tended to grow at the same rate however, since 1980 income for the top 1% has grown 31%, while the bottom 20% has dropped. The authors go on to point out that in 17 of the top 22 developed countries income disparity has grown over the past two decades as measured by the Organization for Economic Cooperation and Development. One trend: corporate executives, doctors, and farmers made up a smaller share of the top 1 percent in 2005 than in 1979. During the same period, the proportion of the wealthiest who work in the financial and real estate industries has doubled. “The top 1 percent earned at least $394,000 in 2012. Through most of the post-World War II era, the top 1 percent earned about 10 percent of all income. By 2007, that figure had jumped to 23.5 percent, the most since 1928. As of 2012, it was 22.5 percent.” Things look pretty rosy for the top earners, but the middle class has not kept up.
“Median household income peaked in 1999 at $56,080, adjusted for inflation. It fell to $51,017 by 2012. The percentage of American households with income within 50 percent of the median — one way of measuring the middle class — fell from 50 percent in 1970 to 42 percent in 2010.” “The United States isn’t any less mobile than it was in the 1970s. A child born in the poorest 20% of families in 1986 had a 9% chance of reaching the top 20% as an adult, the study found — roughly the same odds as in 1971.” This research demonstrates that inequality and social mobility are different problems in the US and not necessarily caused by the same forces.
Just creating more factory jobs is not the answer. We have discovered that workers in the US now “…compete with 3 billion people in China, India, eastern Europe and elsewhere who weren’t working for multinational corporations 20 years ago. Many now make products for Apple, Intel, General Motors and others at low wages. This has depressed middle-class pay. And pay has risen much faster for college graduates than for high-school graduates. These trends have contributed to a “hollowed out” labor market, with more jobs at the higher and lower ends of the pay scale and fewer in the middle.” The example that one of our clients likes to say, is: “How many Americans want to work for $1 an hour like they do in factories in China?” The answer is not many. So just moving factory jobs back to the US is not the answer.
How the wealthiest invest is also different. 90% of the US barely has any savings for retirement per the US Census Bureau and most middleclass Americans derive their wealth from home ownership. “A Pew Research Center study found that the wealthiest 7 percent of households grew 28 percent richer from 2009 through 2011. For the bottom 93 percent, collective wealth fell 4 percent. That’s largely because wealthy households own far more stocks and other financial assets than others.” So investing in equities continues to be the best long term wealth creator!
So what do we need to do to increase wealth? Outside of Draconian methods not permitted in a Democracy, such as requiring people to attend school, obtain engineering degrees and other math and science oriented degrees or confiscate the wealth from the rich through taxes or nationalization. We can plow money into infrastructure as that will increase the US economic activity and hope it trickles down to the masses, most of the time it does. However, in Japan they have tried that for more than 30 years and their income inequality has grown. We can increase taxes on the wealthy and give more to the poor, we have done that since 1980 and now have the top 10% paying more than 70% of US income taxes (per US Treasury) and that did not work to reduce income inequality.
Our real issue is known to all. Doctors, lawyers, engineers, plumbers, electricians, chief executives, welders and carpenters make a higher living than average but in general not an obscene amount more than the average worker. Investment bankers often earn obscene amounts. When they bet wrong the US government has rescued them so they can continue to risk large amounts and harm the economy. When Lehman Brothers collapsed, trillions of dollars of wealth evaporated and most who were hurt were not hedge fund managers but average Americans who lost their jobs, homes and often a future. For whatever reason, we are not addressing that issue. Maybe we do not care? Or maybe we prefer to individually look at what is best for our self and not place the greater good above our own best interest even when that is best for our children and grandchildren. These next few years will show whether we are willing to address the inequity in the system.
Sources:
http://seattletimes.com/html/nationworld/2022765390_apxeconomywealthgap101.html
http://www.census.gov/prod/2012pubs/p20-566.pdf
|
Educational attainment in the United States, Age 25 and Over (2012)[1] |
|
|
Education |
Percentage |
| High school graduate |
87.65% |
| Some college |
57.28% |
| Associate’s and/or Bachelor’s degree |
40.58% |
| Bachelor’s degree |
30.94% |
| Master’s degree |
8.05% |
| Doctorate or professional degree |
3.07% |
| [1]Note that these add up to more than 100% because they are cumulative; e.g. it is assumed that all people with doctorates also have undergraduate and high school degrees, and are thus counted twice in the “lower” categories. It is not assumed, however, that all doctorates or professional degrees have master’s degrees. Age 25 is used rather than age 18 because there are few people aged 18 or over with advanced degrees. “Educational Attainment in the United States: 2012”. U.S. Census Bureau. Retrieved March 24, 2013. Percentages are calculated based on Census data by counting people that had attained that level or higher, with the exception of Master’s and Doctorate. | |